Comparing traces
Several OTDR traces on one chart
Fibres of one cable, two wavelengths, a before and an after: the curves lie over each other, each in its own colour, sharing the cursors. Nothing to install for it.
The plot takes eight curves without signing in, 24 after signing in by email and 48 on Professional. Eight are drawn in their own colours, the rest in a muted tone, and the working curve always sits on top. Details on the pricing page.
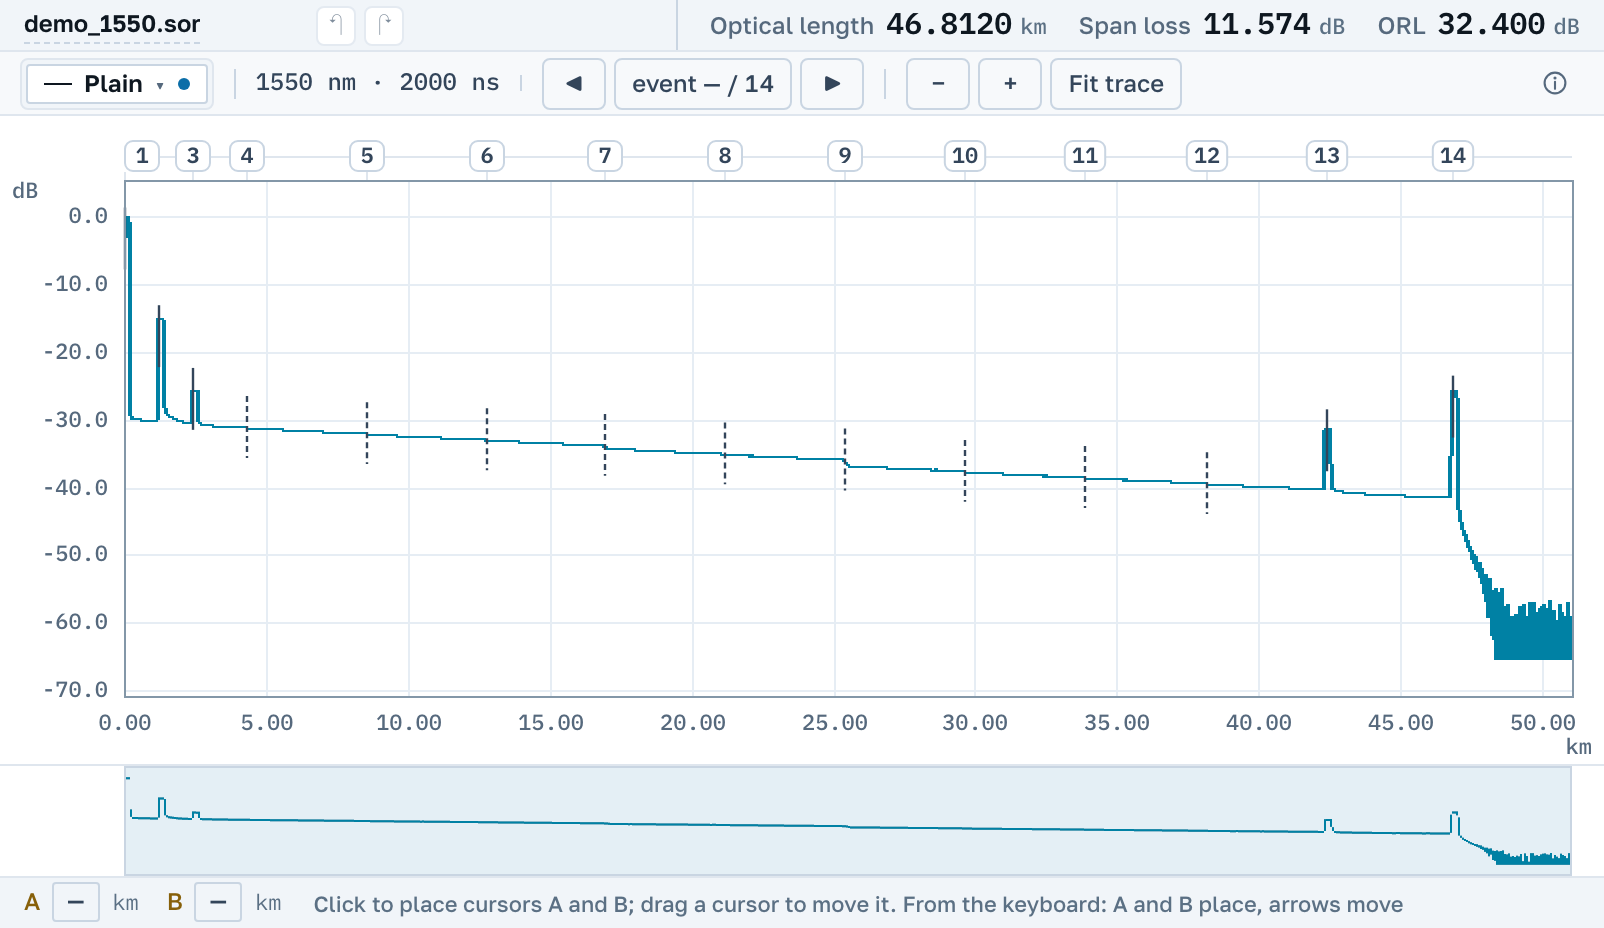
What gets compared with what
The three cases curves are actually put side by side for.
Fibres of one cable
Fibres of one cable on a single canvas, and the odd one out is visible by eye. Clicking a curve makes it the working one; the rest stay where they are. When events at the same distances repeat on most of the fibres, the app names those places itself.
Two wavelengths
1310 and 1550 nm side by side: a bend shows up more strongly at the longer wavelength, and that difference is the only way to tell it from a splice. Wavelengths out of one .msor and out of two separate files overlay the same way.
The far-end measurement
A trace taken from the other end is drawn mirrored and brought together at the cursor. The size of the shift is printed in the legend; without it you would read a level off the curve that is not there. The pair also gets a table: the loss of each splice from both ends and their average.
OTDR trace manager: 96 files without an account, 2048 on Professional
Nothing to install: files stay in the workspace and survive a page reload. Without signing in it holds 96, after signing in 576, on Professional 2048. When there are more fibres than curves on the plot, the list searches by name and wavelength, and the arrow keys step through the fibres one at a time.
When there are dozens of fibres
An overlay shows a discrepancy; the Professional summary table names it: length, loss, worst event and result for every fibre. Professional also has projects, where each job keeps its own files and reports, and Cable mode, which checks every fibre against the drum’s factory data. Overlays, pairs and repeats across fibres stay free.