Knowledge base · Measurement
Why there are three losses and only one span
You place cursors A and B and get three numbers: 2P, LSA and 5P. Each method measures something of its own, and how far their figures drift apart tells you what lies inside the span.
All three come from the samples around the cursors; what differs is what each takes as the level.
By Ilya (engineer, 6 years in fibre optics) ·
Four figures in the readout
The status bar prints them while the cursors sit on the curve.
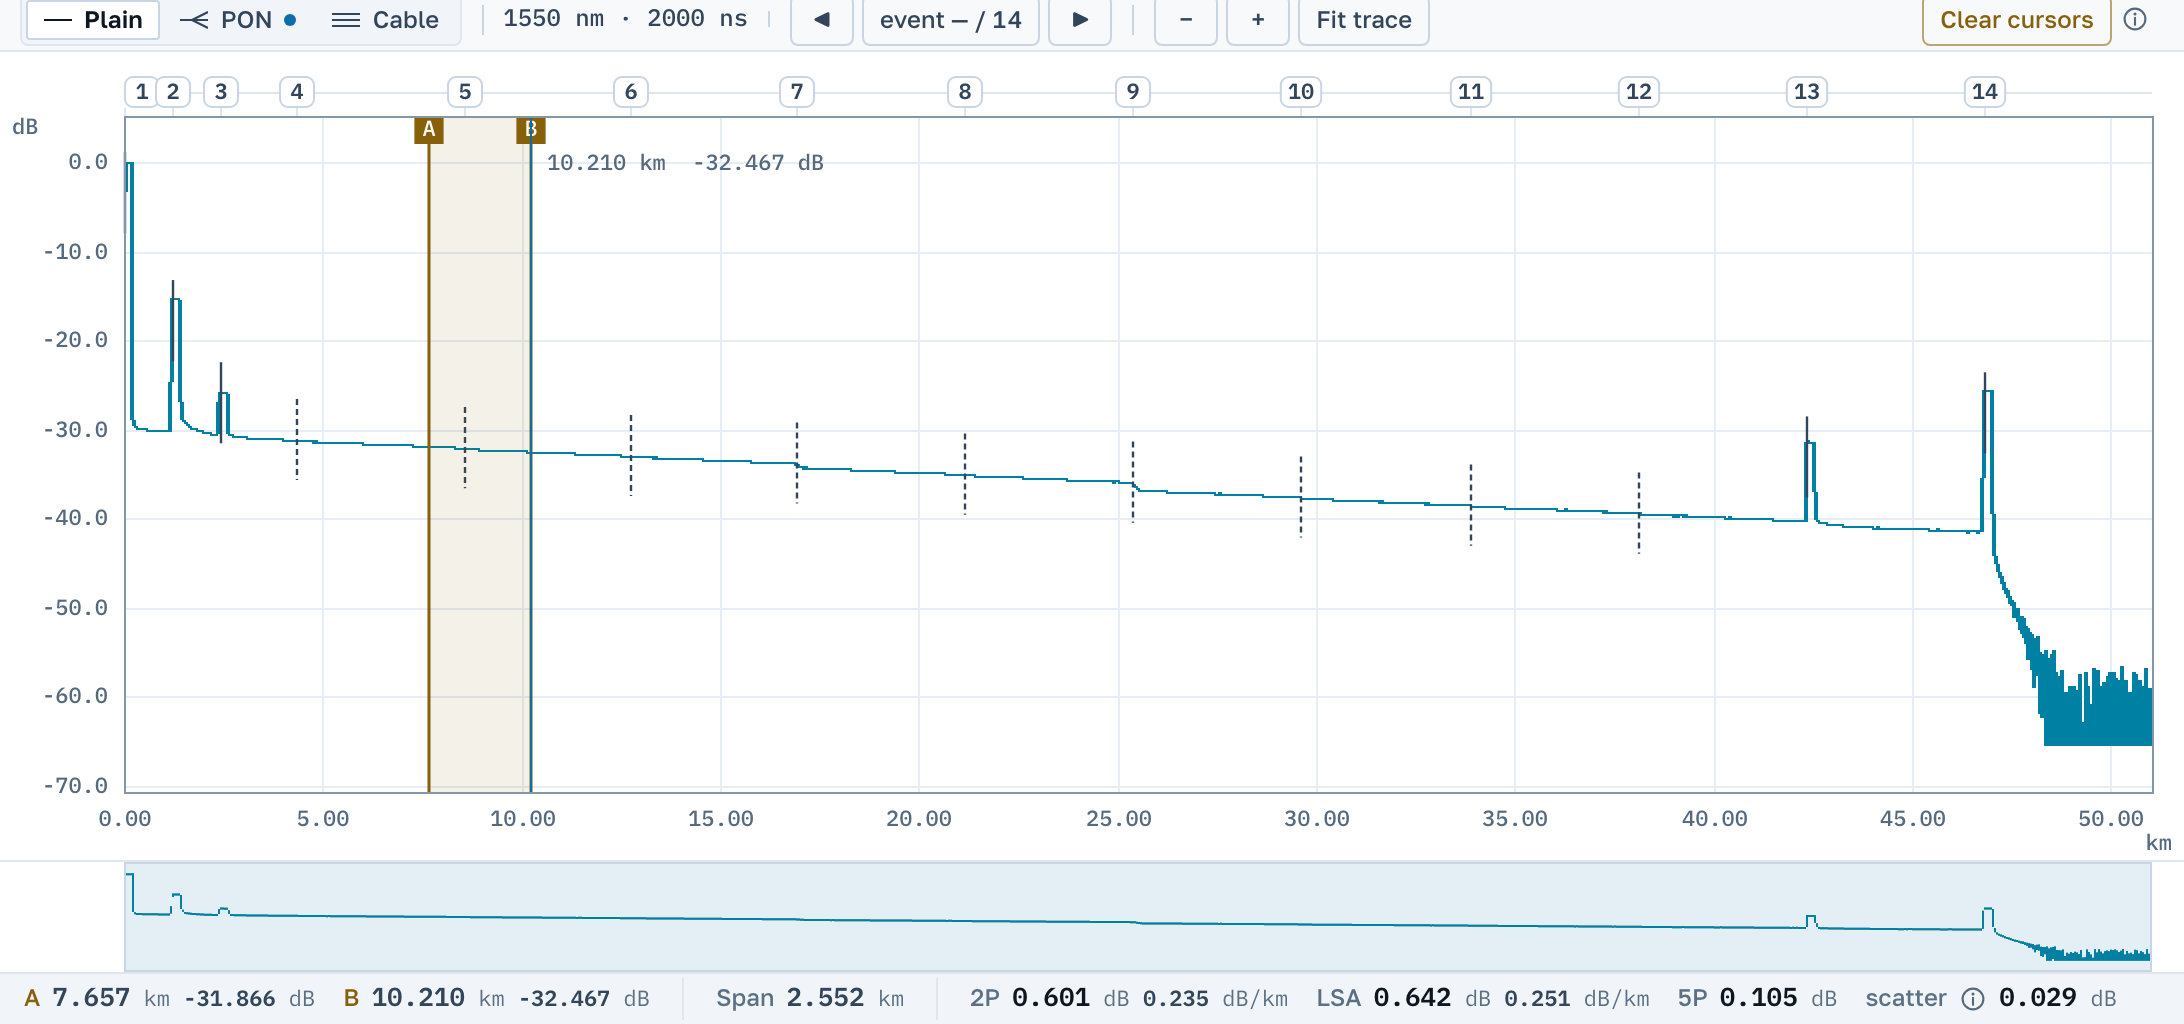
2P: two points
The difference of the levels directly under the cursors. It reads instantly and shows what the eye sees, but it depends entirely on where those two points landed: noise under a cursor goes straight into the result.
LSA: across the whole span
A straight line is fitted by least squares through every sample between the cursors, and the loss is taken from it. Noise averages out, so on a long, even fibre LSA is steadier than 2P.
5P: the loss of the event itself
Two lines fitted over the free fibre outside the cursors, and the gap between their continuations. The fibre does not enter this figure at all, only the step does. It is how an instrument measures a splice: across 1434 corpus measurements our five-point figure differs from the instrument’s by a median of 0.011 dB, while 2P over the same two points differs from it by 0.028 dB. A dash in place of 5P means there is nothing here to believe: too little clean fibre on one side, a file that never said what pulse it was taken with, or fits that came out too rough, and then their scatter is printed beside the dash: it is the number the dash was decided on.
Deviation from the line
How well the samples hold to that fitted line. A small deviation means the span really is uniform and LSA can be trusted on it. A large one means something is inside the span: an event, a step, the edge of a pulse.
Which is closer to the truth, and when
On an even stretch of fibre between two events, take LSA: it uses every sample and does not depend on which noise spike a cursor happened to land on. On an event itself (a splice, a connector, a bend) no straight line goes through a step, and the steeper the step the less LSA resembles the truth; there you read 5P, which is what it is computed for. On an event 2P stays the coarsest of the three: it counts the step and the fibre between the cursors alike. If two numbers have drifted apart and the deviation is large, there is almost certainly an event inside the span, and the span should be cut in two with the cursors.
There is a case in which the better method becomes the worse one, and a vendor described it. LSA is steady precisely because every sample between the cursors goes into the fitted line: a reflection that lands inside goes into it on equal terms with the fibre, and the line stops describing the fibre. The INNO viewer's help says this of its own default method: "if unwanted reflections are included in the marks, the error can actually become large" (its marks are our cursors). Of the two-point method the same page says the mirror image: it "can keep out the reflection in the fibre and unwanted part", but "the analysis result will vary depending on the changes of the mark setting". So the choice between them depends on what has landed inside the cursors: while the span is even, every sample works for LSA; the moment a peak is inside, those same samples work against it, and 2P over two clean points comes closer to the truth.
The method is not ours. A vendor manual describes exactly this one under the name "5-Point LSA": five markers, two on the backscatter before the event, two after, and a fifth on the step itself; lines are fitted to the outer pairs, and the loss value is defined by the position of the centre marker. Where we differ from the instrument is in what is asked of the person: there the operator places all five by hand, here only cursor A on the event, and how far each line reaches is chosen for you. That is also where the remainder of the disagreement with the instrument's own figure comes from: its outer window is tuned to each event, ours is one rule for all of them.
The method goes by two names, and vendors split evenly between them. "Five points" is JDSU and Viavi ("5 Pt Loss") and VeEX ("Splice Loss using 5-Point LSA method"). "Four points" is EXFO (four-point event loss), Anritsu and INNO (Four Points Event Loss, markers ML1–ML4). The geometry is the same for all of them: two lines fitted over the free fibre outside the event, and the gap between their continuations. The disagreement is purely one of counting: whether to count the point at which the gap is read. Those with four markers name only the bounds of the two windows; those with five add the centre marker on the step itself, whose position defines the loss. We write 5P: the gap is read at cursor A, so that point exists here too and a person places it. None of this changes the figure, it comes out the same either way.
What we do not say
Neither 2P nor LSA answers "did this span pass". The threshold is set by your project and your customer's requirement, and there is not one threshold value in the app: none for a splice, none for a connector, none per kilometre. A plausible number sitting in a default field would read as a norm, so there are none.
5P has a limit of its own. The method fits two lines over the fibre outside the cursors, and on a noisy trace there is nothing to fit them to: the farther from the instrument and the fewer the averages, the worse both lines hold. We do not print a figure we do not believe ourselves; a dash stands in its place. Measured over 885 corpus measurements where the instrument's own number can be checked, and where its own markers reproduce it: where we print our figure, nine in ten land within 0.05 dB of the instrument's. Rows where the instrument disagrees with itself are left out of the measurement, because there is nothing there to check against. What to do when the dash is there: read 2P. Instruments work the same way: when close events leave no fibre to fit a line to, vendor manuals send you to the two-cursor method, and the instrument itself refuses to compute and reports that a slope was found between the cursors. We name the same reason with a number: the scatter of the fits, printed beside the dash.
Next
The figures are computed by the same code everywhere: in the browser and on the server it is literally the same arithmetic.