Knowledge base · Acceptance
Cable mode: checking each fiber against the factory data
A cable leaves the factory on a drum with a factory test report: its length and its attenuation at each wavelength. At incoming inspection every fibre is shot with an OTDR from one end and compared with that sheet. Cable mode puts the factory data on screen next to what was measured, so you no longer compare each trace by eye.
Cable mode is paid: the factory data comparison is part of the paid plan. The traces themselves still open, overlay and page through without it.
By Vera (new to the field) ·
What the mode does
It leaves your files as they are and puts next to each one what the instrument recorded and what the factory data promise.
The factory data on screen
A Factory data tab appears in the lower panel. You enter the optical length from the factory report, a tolerance and one row per wavelength. There is one set of factory data for the whole file list: enter it once and every fibre is checked against it.
A comparison for the working file
Under the factory data fields sits a table with three columns: measured, factory and deviation. Its rows are length, attenuation and index of refraction. Switch to another fibre and the table follows it.
When a cell turns red
You set the length tolerance and the attenuation limit. When a fibre goes past them the cell turns red, and an Outside factory data mark appears in the document line above the chart. A deviation with no limit entered stays a plain number.
Turning it on
Above the chart there is a view switch: Plain, PON and Cable. Press Cable. The mode applies to the whole file list at once rather than to one file, because at incoming inspection the files in the list are usually the fibres of one cable. On a narrow screen the switch folds into a single button that opens a list of the same three views.

If you are not signed in, the app offers Sign in right at the switch: the mode is part of Professional, and once you are signed in you can try it free for three days. If you are signed in without the paid plan, the same spot offers Try it free and Buy Professional. Either way the screen loses nothing: the chart, the event table and the totals stay as they were.
Cable and PON do not run together, since a cable straight from the factory has no splitters. Plain turns the mode off, and the screen is the same as without the mode.
Entering the factory data
Open the Factory data tab on the right of the lower panel. It starts with three fields. Drum takes a number or a name; it is a label for you and plays no part in the comparison. Length and tolerance are in metres. This is the optical length, not the sheath length of the cable: the fibre lies in the cable with some slack and is longer than the sheath. With the tolerance empty, the length is still printed and compared, but it gets no verdict. Each field is applied with Enter: if you leave it without pressing Enter, what you typed is dropped.
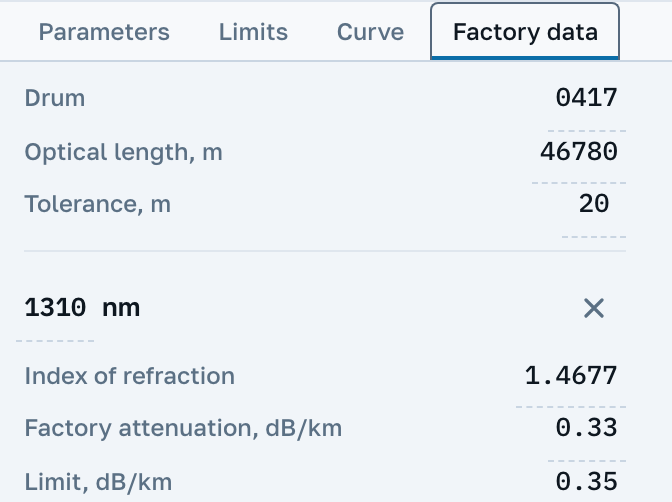
Below them come the wavelength rows; Add a wavelength adds one. Each row has three fields: index of refraction, factory attenuation and a limit, both of the last two in dB/km. The limit may stay empty. The comparison picks the row that matches the open file's wavelength, and if there is none it says "No factory data at … nm" instead of showing a dash.
The factory data are remembered by this browser. On another computer or in another browser you will need to enter them again.
What the comparison shows
The length row holds the optical length of the span as the instrument recorded it. If the instrument recorded the span, this is the same value as the Optical length figure above the chart; if it did not, the comparison says so: "The instrument did not record it". Attenuation is the Span loss divided by the span length. The index of refraction comes from the file and is printed next to the factory value. It gets no verdict, and we do not recalculate traces with the factory index, because that would be an edit to the file.
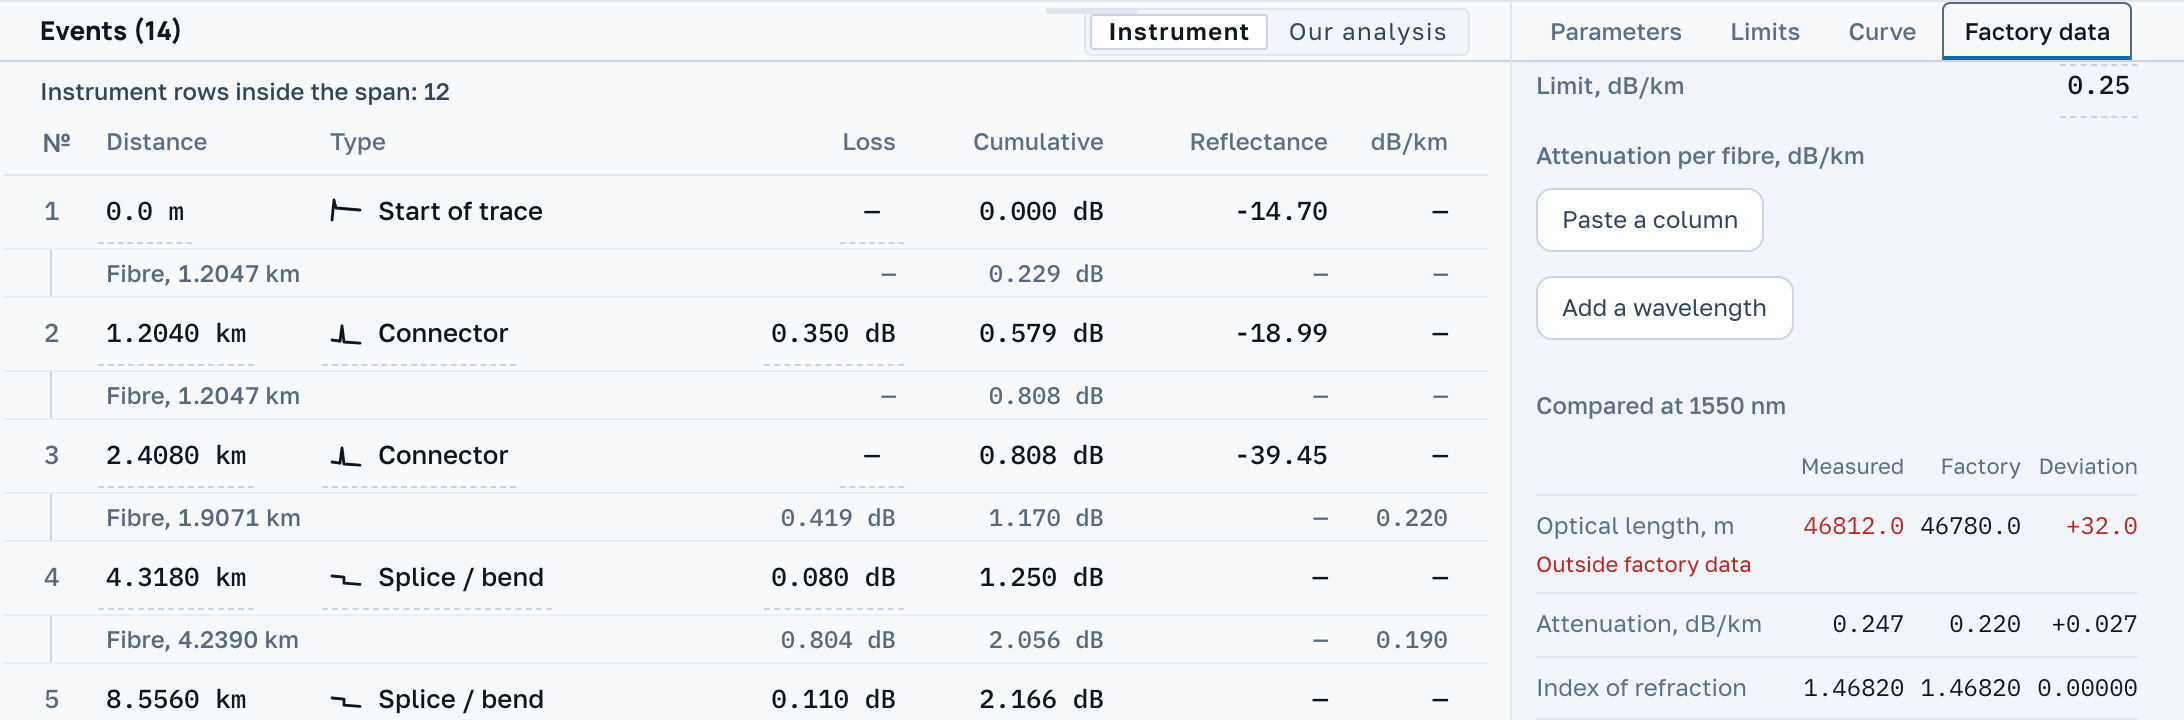
Only a step past a limit you entered is marked red: length outside the tolerance, or attenuation above the limit. The measured value and the deviation turn red, and the words Outside factory data appear under the row label, so the verdict does not rest on colour alone. The same mark appears in the document line above the chart, and clicking it opens Factory data.
Above the event table a line counts the instrument rows inside the span. A continuous cable from the factory has no closures, so none are expected there. The mode does not call them defects: you decide what stands behind them, as with a splitter in PON mode. Only the instrument's rows are counted; rows found by Our analysis are not.
What the mode does not do
We do not supply limits. The tolerance and the limit come from the factory report or the supply contract, and an empty field gives no verdict.
The mode does not call a fibre good or faulty, and it does not edit files. It compares what you entered with what the instrument recorded and shows where they part.
Next
You can look through a cable's fibres without this mode: overlaying them on one chart and paging through the files are free. Only the factory data comparison is paid.