Knowledge base · Documents
How to read an OTDR report
Someone sent you a PDF or a printout for one fibre: a header, a picture of the trace, a table running onto a second page. Here is what each part of it means, how the reports of different makes differ, what such a sheet cannot tell you at all, and where two reports on the same file stop agreeing.
Open your own file and see the same thing
The report is printed by software, while the numbers in it belong to the instrument. Only part of the measurement makes it onto the page.
By Vera (new to the field) ·
What every report is made of
We went through the way seven programs build a report, from vendor desktop software to browser tools. All seven put the same parts on the page.
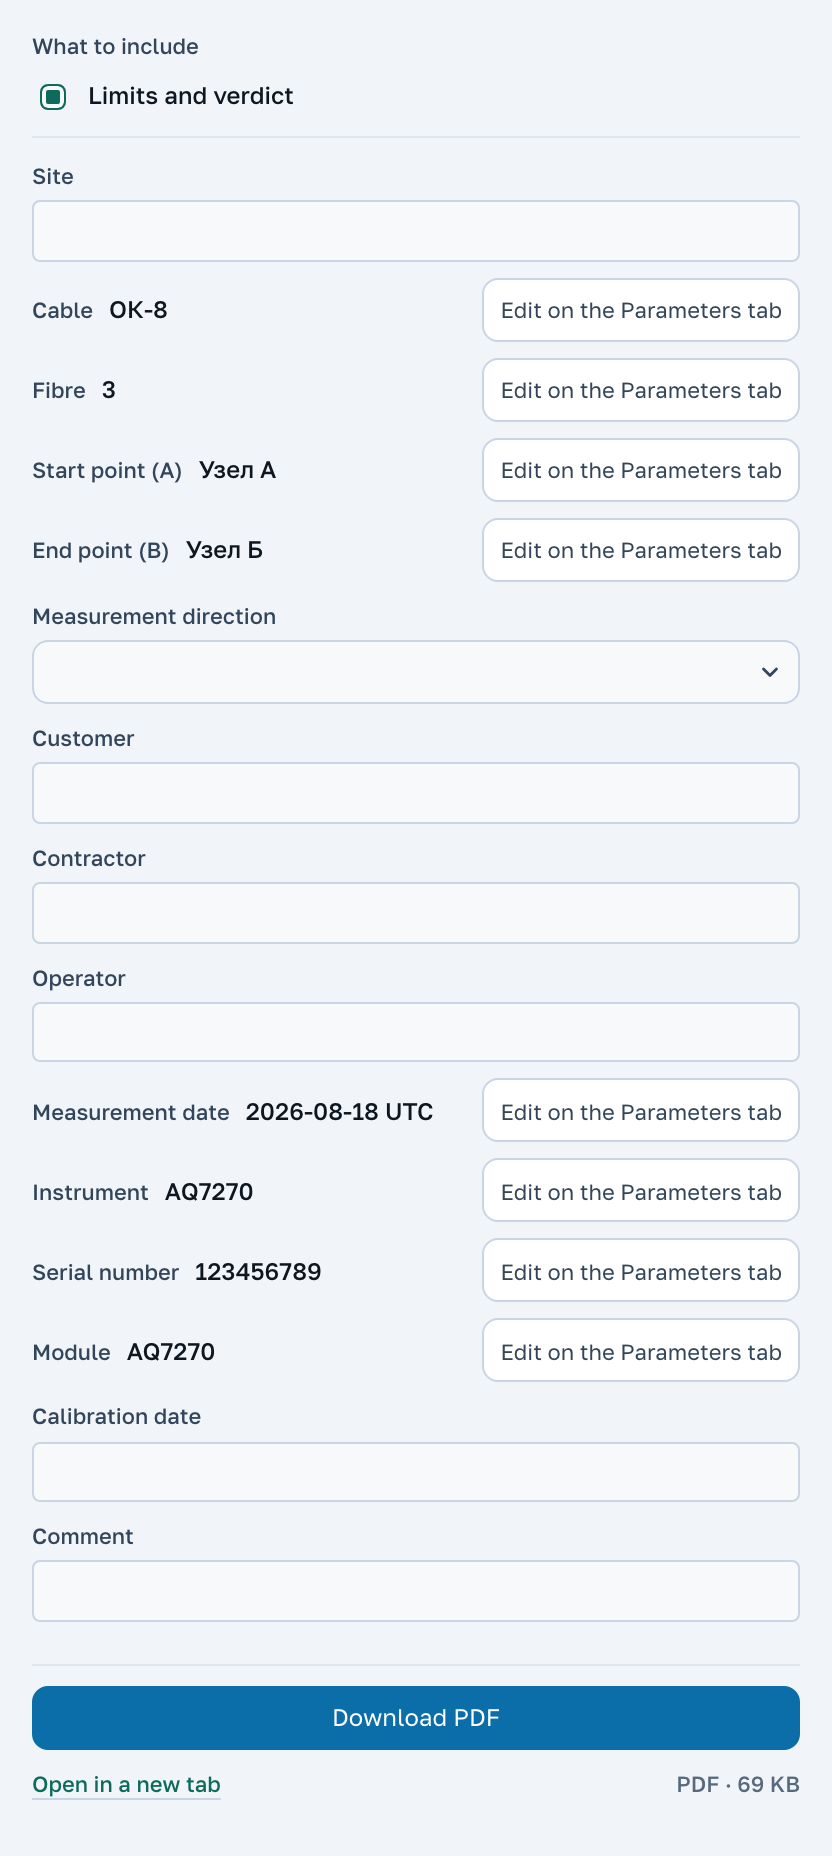
The header
Who measured, when, with which instrument and at which settings: wavelength, pulse width, index of refraction, averaging time. People usually read this part last, yet this is what the arguments end up being about: when two shots of one fibre disagree, the reason is usually in the header rather than in the table.
The picture of the trace
A single image at whatever zoom the person printing it happened to choose. It shows the shape of the trace and nothing small: an event inside a dead zone looks like plain fibre on paper, and two close splices look like one step.
The table and the totals
One row per event, and under them a block of totals: length, total loss, loss per kilometre, optical return loss for the whole link. Every program we looked at prints that block, and it is usually the part copied into the acceptance paperwork.
What the columns hold
Distance is measured from the start of the trace, meaning the instrument's connector, not from the start of the cable and not from a kilometre marker. If a launch cable was used, its full length is inside that number. The column goes by several names: distance, position, location.
The event type is named by the instrument, and this is where vendors disagree most. The same non-reflective event is called a splice, a joint or a fusion; a reflective one is a connector or a mated pair; a false reflection is a ghost or an echo. Behind the different words is the same row of the file.
Then come the numbers for the event: its loss, its reflectance, the attenuation of the section up to the next event, and the loss accumulated from the start of the trace. Reflectance is written as a negative number and reads backwards: the closer to zero, the stronger the reflection. An empty cell means the instrument recorded no such figure, not that the figure is zero.
The end of fibre sits in the same table as the last row, and its loss is usually left out of the sum. That is why the total link loss in the summary and the sum of the loss column often disagree, and it is not a misprint.
Reports from different makes
The parts are the same everywhere, but the page layout and the column names belong to each maker. Three things differ most often.
Cumulative loss
Many reports have a column with the loss from the start of the trace up to the event, and each maker names it in its own way: cumulative, total or summed loss, but it is the same quantity every time.
A page per fibre
A large report for a cable is usually not one document but a stack of single-page reports, one sheet per fibre, stitched into one PDF. Sometimes a sheet carries two wavelengths side by side: two graphs and two tables.
Thresholds next to the verdict
Where a report gives a verdict, the thresholds are printed in the header or on a page of their own: for loss, for reflectance and for the fibre end. Yokogawa prints them as a block of event search parameters, VIAVI as a thresholds page that cannot be left out of the report.
Yokogawa and Anritsu also have a report of a different kind, a summary table for the whole cable. A row there is a fibre, not an event. In Yokogawa's table the columns are events lined up across all the fibres of the cable, with loss and reflectance under each, and cells over a threshold are red. In Anritsu's, the fibre's row carries the totals from both ends at once: loss from A to B and from B to A, their average and difference, the length and the return loss in each direction. Such a table is read along the row, looking for the fibre that stands out from its neighbours.
How to read the reports of three makes, from the header to the table, is covered on separate pages. EXFO and VIAVI instruments build the report themselves, and for Fluke it is printed by LinkWare PC.
Why one file gives two verdicts
A pass mark next to a row looks like a property of the measurement, but it depends on the settings of whichever program printed the sheet. A person types those thresholds in, and at the next contractor or on the next project they are different numbers. So the same file can get both a pass and a fail.
We have looked inside the files: some instruments write their own thresholds and their own per-event verdict into the file itself. Desktop software still judges by its own settings rather than by those, and prints its own answer. Hence the everyday case where the instrument screen in the field said one thing and the paper from the office says another.
There is a nastier trap. With one vendor the threshold set stored in the file is not the set the instrument actually judged by. So a verdict in someone else's report is only worth trusting alongside the thresholds it was reached with, and a decent report prints them next to it. With no thresholds on the page, the pass mark cannot be checked.
What the report leaves out
Paper shows the outcome of an analysis, while the measurement itself stays in the file. The file holds every sample of the curve, so you can put cursors wherever you like, measure a span between two points, look at an event up close and find what never reached the table because it fell under the detection threshold. A report gives you only the finished rows, and you cannot add to them.
The index of refraction is printed in the report, yet you cannot recalculate distances with it, because that needs the samples themselves. An error in that one field shifts every distance in the table, and it usually comes to light when the crew digs in the wrong place.
So ask your contractor for the file, not only for the paper. It opens here in the browser: the same events and the same totals, but with cursors and zoom. You can build your own report from it on the spot, using thresholds you set yourself.
Next
We ship no threshold values of our own. A limit comes from the project, from the contract or from an industry document, and a pass mark means exactly that somebody entered those numbers.