Knowledge base · Acquisition
How to use an EXFO OTDR and read its report
This is the order of work in the OTDR application on EXFO instruments of the FTB and MAX platforms, from a clean connector to a saved file. Further down we go through the PDF report the instrument builds itself. It follows the EXFO user guide in our own words, and where the vendor has a word of its own, the word is given.
The instrument saves a trace in its own .trc format, all wavelengths in one file, or as .sor, one file per wavelength. Both open here.
By Vera (new to the field) ·
Before you press Start
The vendor's guide has you do these three things before pressing Start.
A clean connector and the right port
Clean the connectors first, then connect them. If the instrument has two OTDR ports, the fibre goes into the one that matches the wavelength you need. The vendor warns separately that a live fibre must not be connected to an ordinary OTDR port; the instrument has a live-fibre port for that.
Refractive index
The group index, the backscatter coefficient and the helix factor are set for the particular cable. Every distance in the file depends on the index, so it is taken from the cable's datasheet rather than left as it was. Why is covered in the guide on refractive index.
First connector check
The function looks at the injection level and warns when the first connection loses too much, which most likely means the fibre is not connected to the instrument. It is off by default. The same advanced settings take the lengths of the launch and receive fibres, if the setup has them.
Acquisition
All wavelengths are selected by default. Range, pulse width and acquisition time can be set by hand, or left to the instrument. It then picks them from the connected link, and chooses the pulse so that the fibre end shows with enough margin above the noise. How a long pulse differs from a short one is covered in the guide on pulse width.
After Start the instrument acquires the wavelengths one by one, from the shortest to the longest. Settings can be changed during the acquisition, but averaging on the current wavelength then starts over. The acquisition can be stopped at any moment, and the screen keeps whatever has been gathered by then. After analysis the events appear on the Events tab.
The trace is saved with the Save button, and the instrument builds the file name itself from its automatic naming rules. EXFO's default format is its own, .trc. The settings can switch it to .sor, and then each wavelength goes into a separate file.
How to read an EXFO report
The instrument builds the report itself, as a PDF. The overall verdict, Pass or Fail, sits at the top right. Below it come the general data (file, date, cable, fibre, customer), locations A and B with their operators, the instrument's model and serial number and its calibration date. The results block gives the span totals: length, loss, average loss, average and maximum splice loss, and the span ORL.
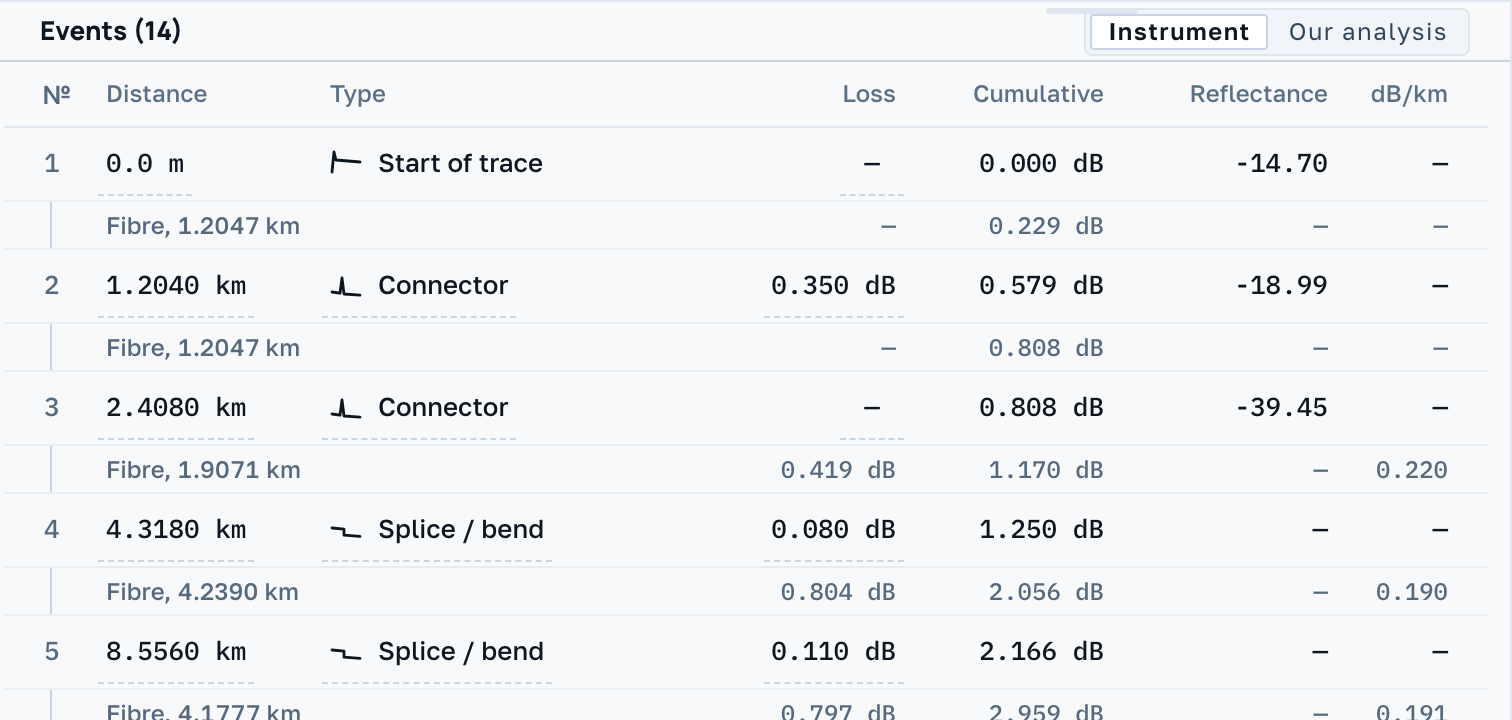
Under the graph come the markers a, A, B and b. Between A and B the report gives the least-squares attenuation and loss; on an event it gives the four-point loss and the maximum reflectance. The vendor calls four-point loss the preferred method, and it is the one in the event table. Rows that failed a threshold are printed white on red. A merged event, where the instrument did not separate neighbours, carries one loss for the whole group and the highest reflectance of its parts. A positive event, whose loss came out with a minus, does not show the true loss; only a measurement from the other end gives it.
The report ends with the Pass/Fail thresholds and the acquisition settings: refractive index, backscatter, detection thresholds, pulse, range and time. These are the figures the operator set for this job, not a vendor norm. Which thresholds apply is up to the contract; see the guide on pass/fail thresholds.
The same file here
Open a .trc or .sor from an EXFO instrument and the screen shows the trace, the event table and the acquisition parameters. If the operator set pass/fail thresholds on the instrument, they are recorded in the file itself: the Limits panel says so and offers a Use these button. An EXFO positive event is called Gainer here, with an explanation beside it of where the minus comes from.
An EXFO PDF report does not open here: it is a document, not a measurement. You can make your own PDF sheet for the trace right here, free.