Knowledge base · Acquisition
How to use a VIAVI OTDR and read its report
This is the order of work in the OTDR application on VIAVI instruments: the T-BERD/MTS platforms, SmartOTDR and the others that run the same firmware. Further down we cover reading the result on the instrument's screen and in the PDF report it builds itself. It follows the VIAVI user manual in our own words.
The instrument writes a plain .sor, and can save overlaid traces as one .msor file. Both open here.
By Vera (new to the field) ·
Two modes, and what to check before Start
On a VIAVI an acquisition starts with choosing one of two modes, and before it runs the instrument checks two things itself.
Smart TEST or Expert OTDR
Smart TEST acquires from a ready-made configuration file: every acquisition setting and the saving rules are already in it, and before Start only the basics can be adjusted. The configuration file itself is made in Expert OTDR mode, where every setting and the full analysis are open. So Expert is set up once, and the crew then shoots in Smart TEST.
An inspected connector
The manual starts with inspecting and cleaning the connector end face, and only then connects it to the port. After Start the instrument shows the connection quality for a few seconds, so a bad first connector shows up straight away rather than after the whole acquisition.
Light in the fibre
If there is traffic on the fibre, the instrument notices it and asks whether to go on. Answering no does not start the acquisition. Answering yes starts it, but foreign light in the fibre spoils the trace, and such a measurement cannot be relied on.
Acquisition
Expert takes the wavelengths, range, pulse width and acquisition time, or an automatic mode in which the instrument picks them itself. The advanced settings hold the detection thresholds, the refractive index and the scatter coefficient. The Link ID is filled in there too: job, cable, fibre number, locations A and B, and the direction of the measurement, A to B or back.
Real time mode shows the trace while it builds up and measures loss, ORL and reflectance with cursors during the acquisition. A normal acquisition runs with a progress bar, and at the end the instrument beeps and opens the result with a Pass or Fail verdict window. Pulse width works as on any OTDR: a long pulse sees further, a short one tells apart events that stand close together.
Alarm thresholds are set under Alarms, and nothing needs to be shot again for them: they apply to what has already been acquired. There are three levels: no alarm, warning and fail. A warning paints the row yellow, a fail paints it red. Thresholds can be your own or a ready set from one of the industry standards, and then they are the standard's figures, not the instrument's. How a pass/fail threshold differs from a norm is covered in the guide on pass/fail thresholds.
How to read a VIAVI result and report
After the acquisition the SmartLink view opens. At the top is the event line with the alarm icon, in the middle a diagram of the link with each event drawn as an icon, and at the bottom the link table with totals for each wavelength: green within limits, red on a fail. Tapping an icon shows the event type and the threshold above which it counts as a defect, and on a fail a possible cause as well. Besides SmartLink there are a trace view and a table view, and the table can be filtered down to the failed rows.
The instrument groups events that stand too close together. No loss is shown for the individual events of a group, and the group's reflectance is the worst of its parts. Other vendors call this a merged event: the instrument did not separate the neighbours, and only a new acquisition at a short pulse can separate them later. The type of any event is changed by a long press on its icon.
The report comes from the fast report key on the results page: next to the .sor the instrument writes a PDF or text file of the same name. From the file explorer a PDF can be built for many files at once, one trace per page or several per page, and the reports of different files can be joined into one with the Merge key. The VIAVI logo in the report header changes to your own if you put a logo.jpg file at the root of the instrument's disk.
The same file here
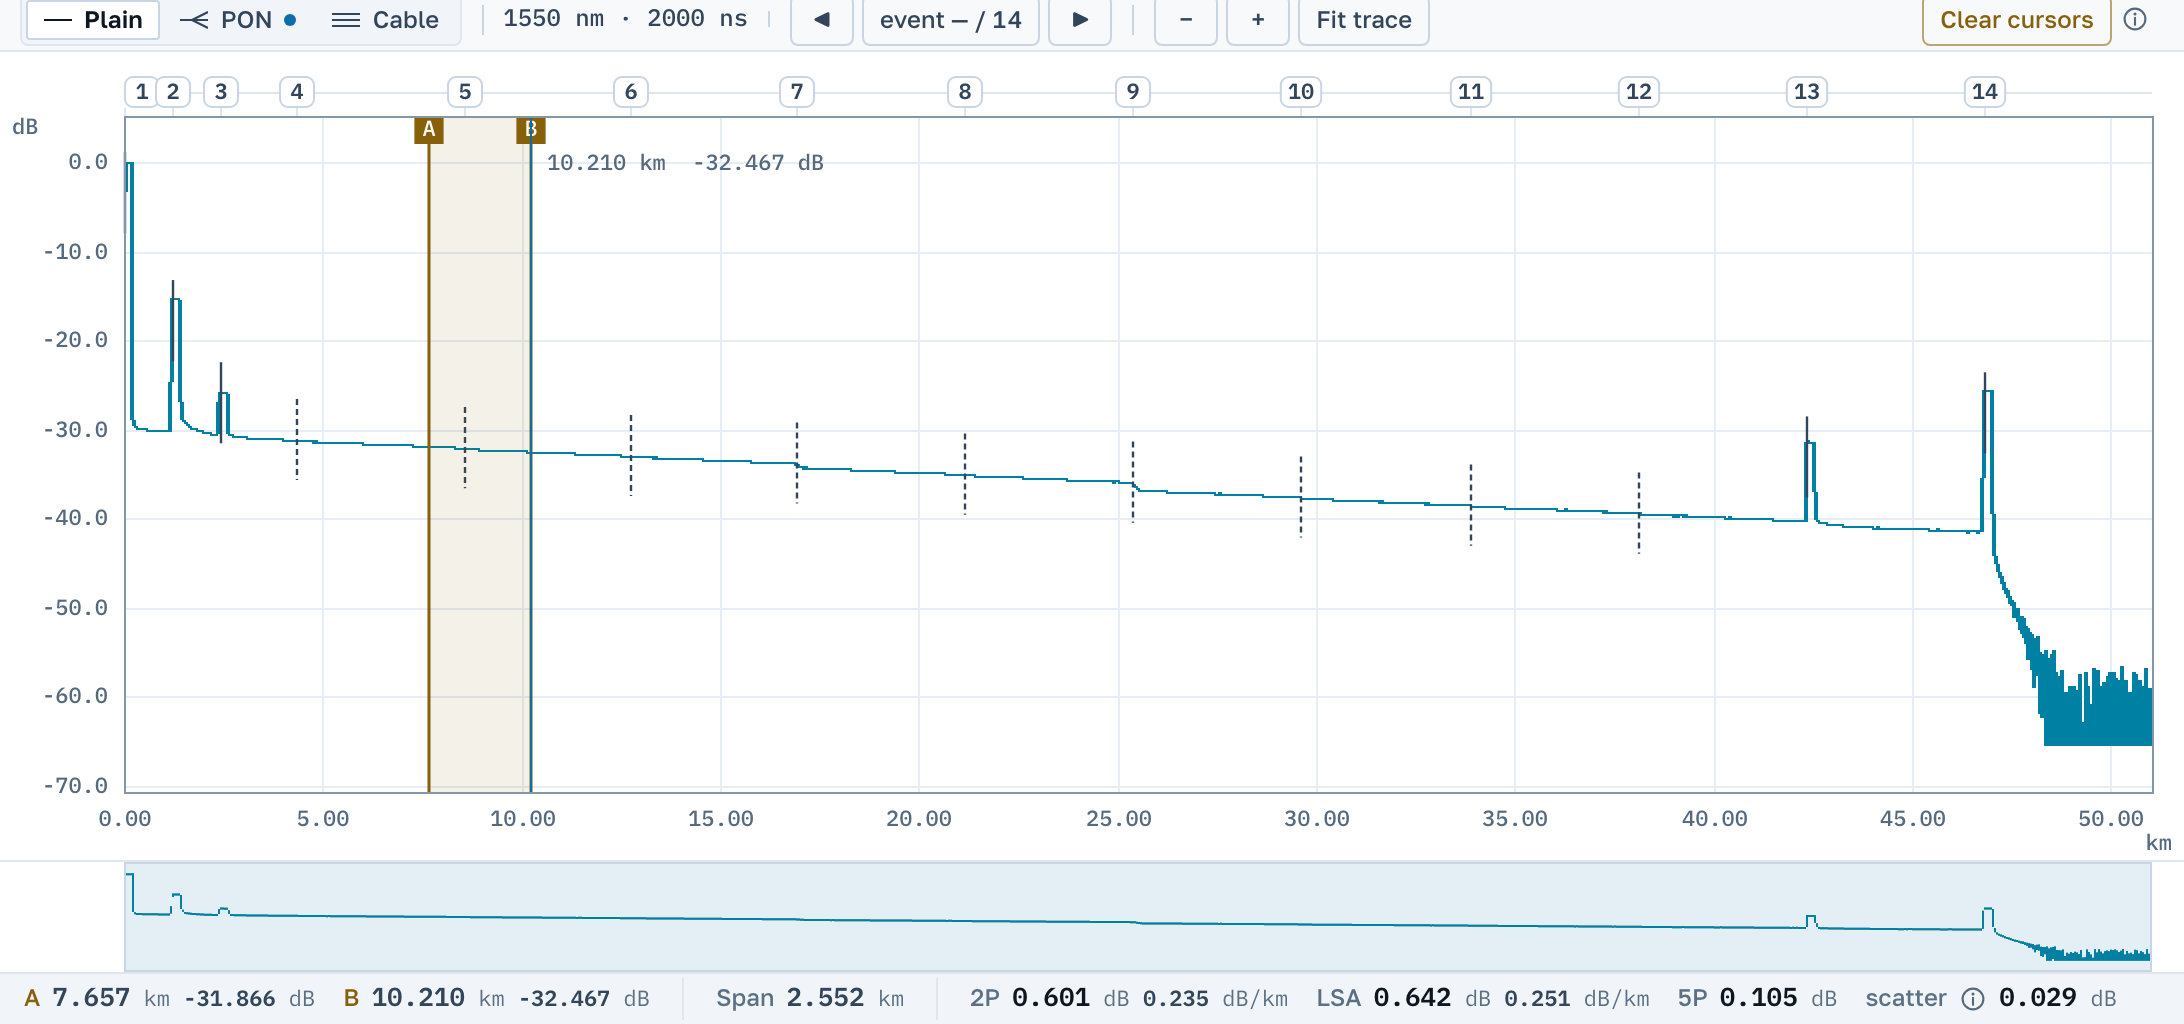
Open a .sor or .msor from a VIAVI instrument and the screen shows the trace, the event table the instrument recorded and the acquisition parameters. The traces in an .msor go into the list one by one, and the selection window can open them all at once. Open two traces of the same fibre shot from opposite ends and they can be paired, so that the splice loss reads as the average of the two directions.
A VIAVI PDF report does not open here: it is a document, not a measurement. You can make your own PDF sheet for the trace right here, free.