Knowledge base · Acquisition
How to use an OTDR
This is the order of work with an OTDR of any make: what to do before Start, which settings to choose, and what to check on the trace while the instrument is still in your hands. Each step links to its own detailed guide, and at the bottom are pages on EXFO, VIAVI and Fluke instruments and on low-cost mini OTDRs.
There are no norms or ready values here. Thresholds come from the contract, and acquisition settings are chosen to suit the link.
By Vera (new to the field) ·
Before you start
These decide whether the trace will be any good at all.
A clean connector
The end faces of the instrument's, the launch cable's and the link's connectors are inspected and cleaned before connecting. A dirty connector adds loss and a strong reflection right at the start of the trace, and everything next to it hides behind it. How a connector's reflection looks on a trace is covered in the guide on connector reflectance.
Launch cable
A launch cable goes between the instrument and the link, and a receive cable at the far end if the last connector needs measuring. Without a launch cable the first connector of the link hides in the instrument's own dead zone, and there is nothing to measure it by.
Refractive index
The refractive index is taken from the cable datasheet and entered in the settings before the acquisition. The instrument turns time into distance with it, and a wrong figure shifts every distance on the trace at once.
Acquisition settings
The usual practice is to shoot at two wavelengths, 1310 and 1550 nm: bends show more strongly at the longer one, and comparing the two traces tells a bend from a splice. Set the range comfortably longer than the link. If it is shorter, the reflection from the far end lands in the next trace and draws a false peak, a ghost; there is a separate guide on event types.
Choose the pulse width for the task: a short pulse separates close events, a long one reaches the far end. Give averaging more time when the link is long or the events are small: the noise drops and the curve gets cleaner. How the instrument picks the pulse itself in automatic mode is shown in the same guide with the vendor's table.
Automatic mode is fine for a first look and for finding a break. For a measurement that goes into the paperwork, it is better to set the parameters yourself and keep them the same for every fibre of the cable, so that the traces can be compared with each other.
After the acquisition, while the instrument is in your hands
Look at the start of the trace: the first connector of the link should sit after the launch cable, clear of the dead zone. If it cannot be seen, reshooting at a short pulse costs less than coming back.
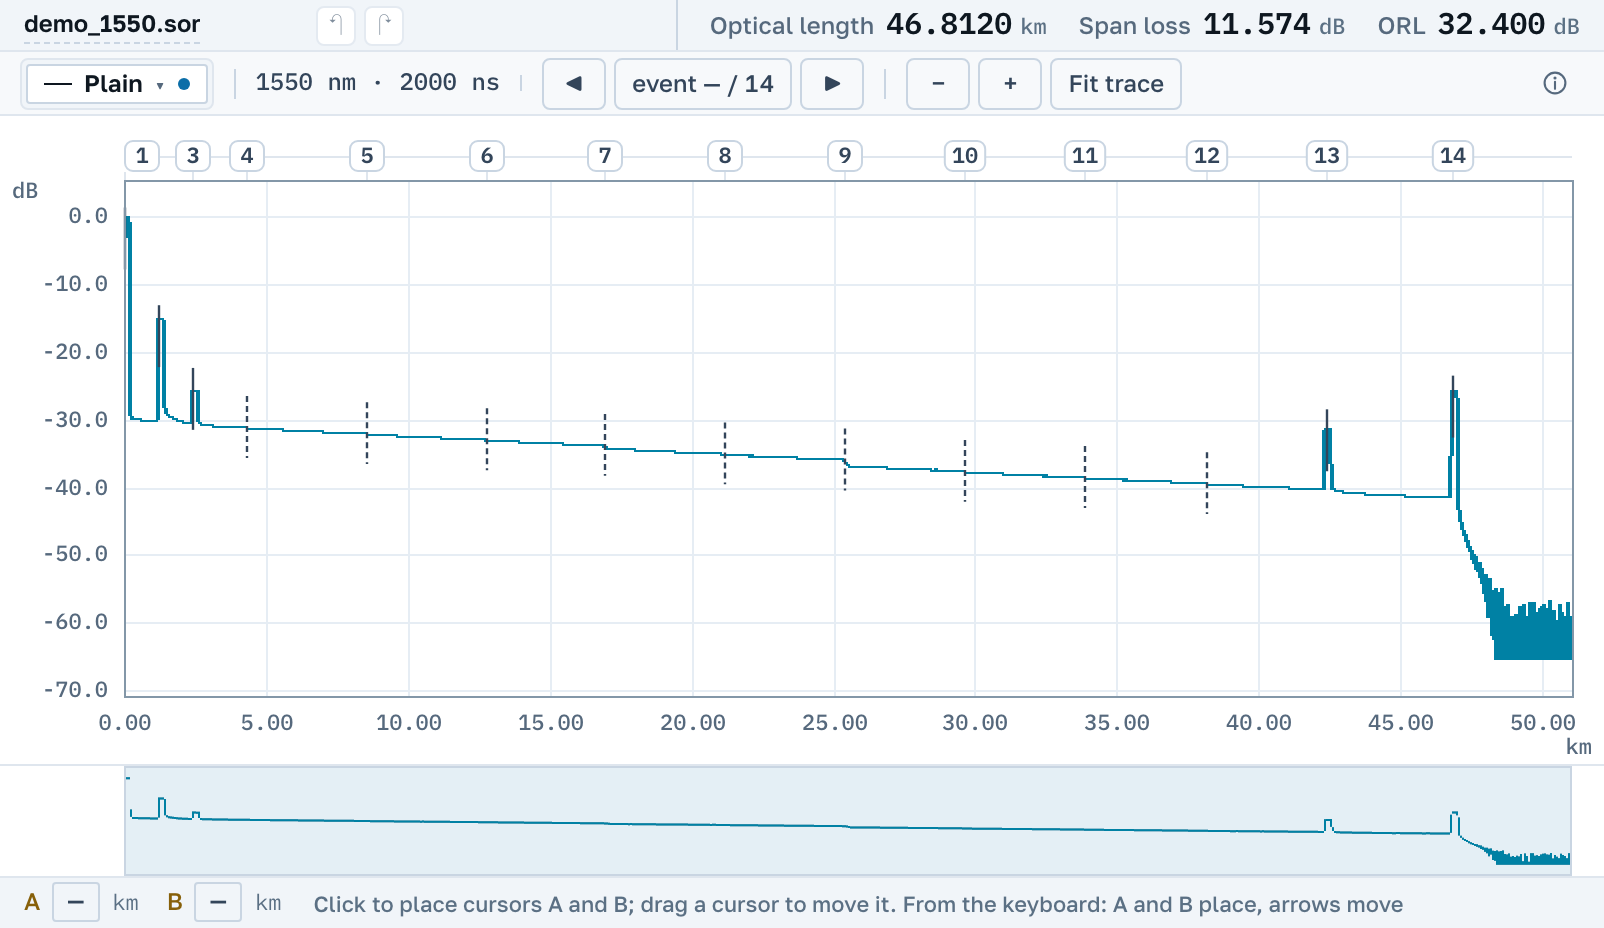
Look at the end: the trace should finish with a reflection from the end face, or a break, and noise after it, not stop where the range stops. Check the event table: a small splice may be missing from it because of the detection threshold even though it shows on the curve.
Save the file under a name you can find it by later: site, cable, fibre number, wavelength and the end it was shot from. If the splice losses have to be exact, shoot the same fibre from the other end as well: the average of two measurements from opposite ends removes the error of a one-way reading.
A Pass or Fail comes from thresholds set by the contract, not by the instrument or the software. Where they come from is covered in the guide on pass/fail thresholds.
How it works on your instrument
A file from any instrument opens here in the browser: the trace, the events and the acquisition parameters, without the maker's software.