Knowledge base · Measurement
How to read an optical loss test (OLTS) result
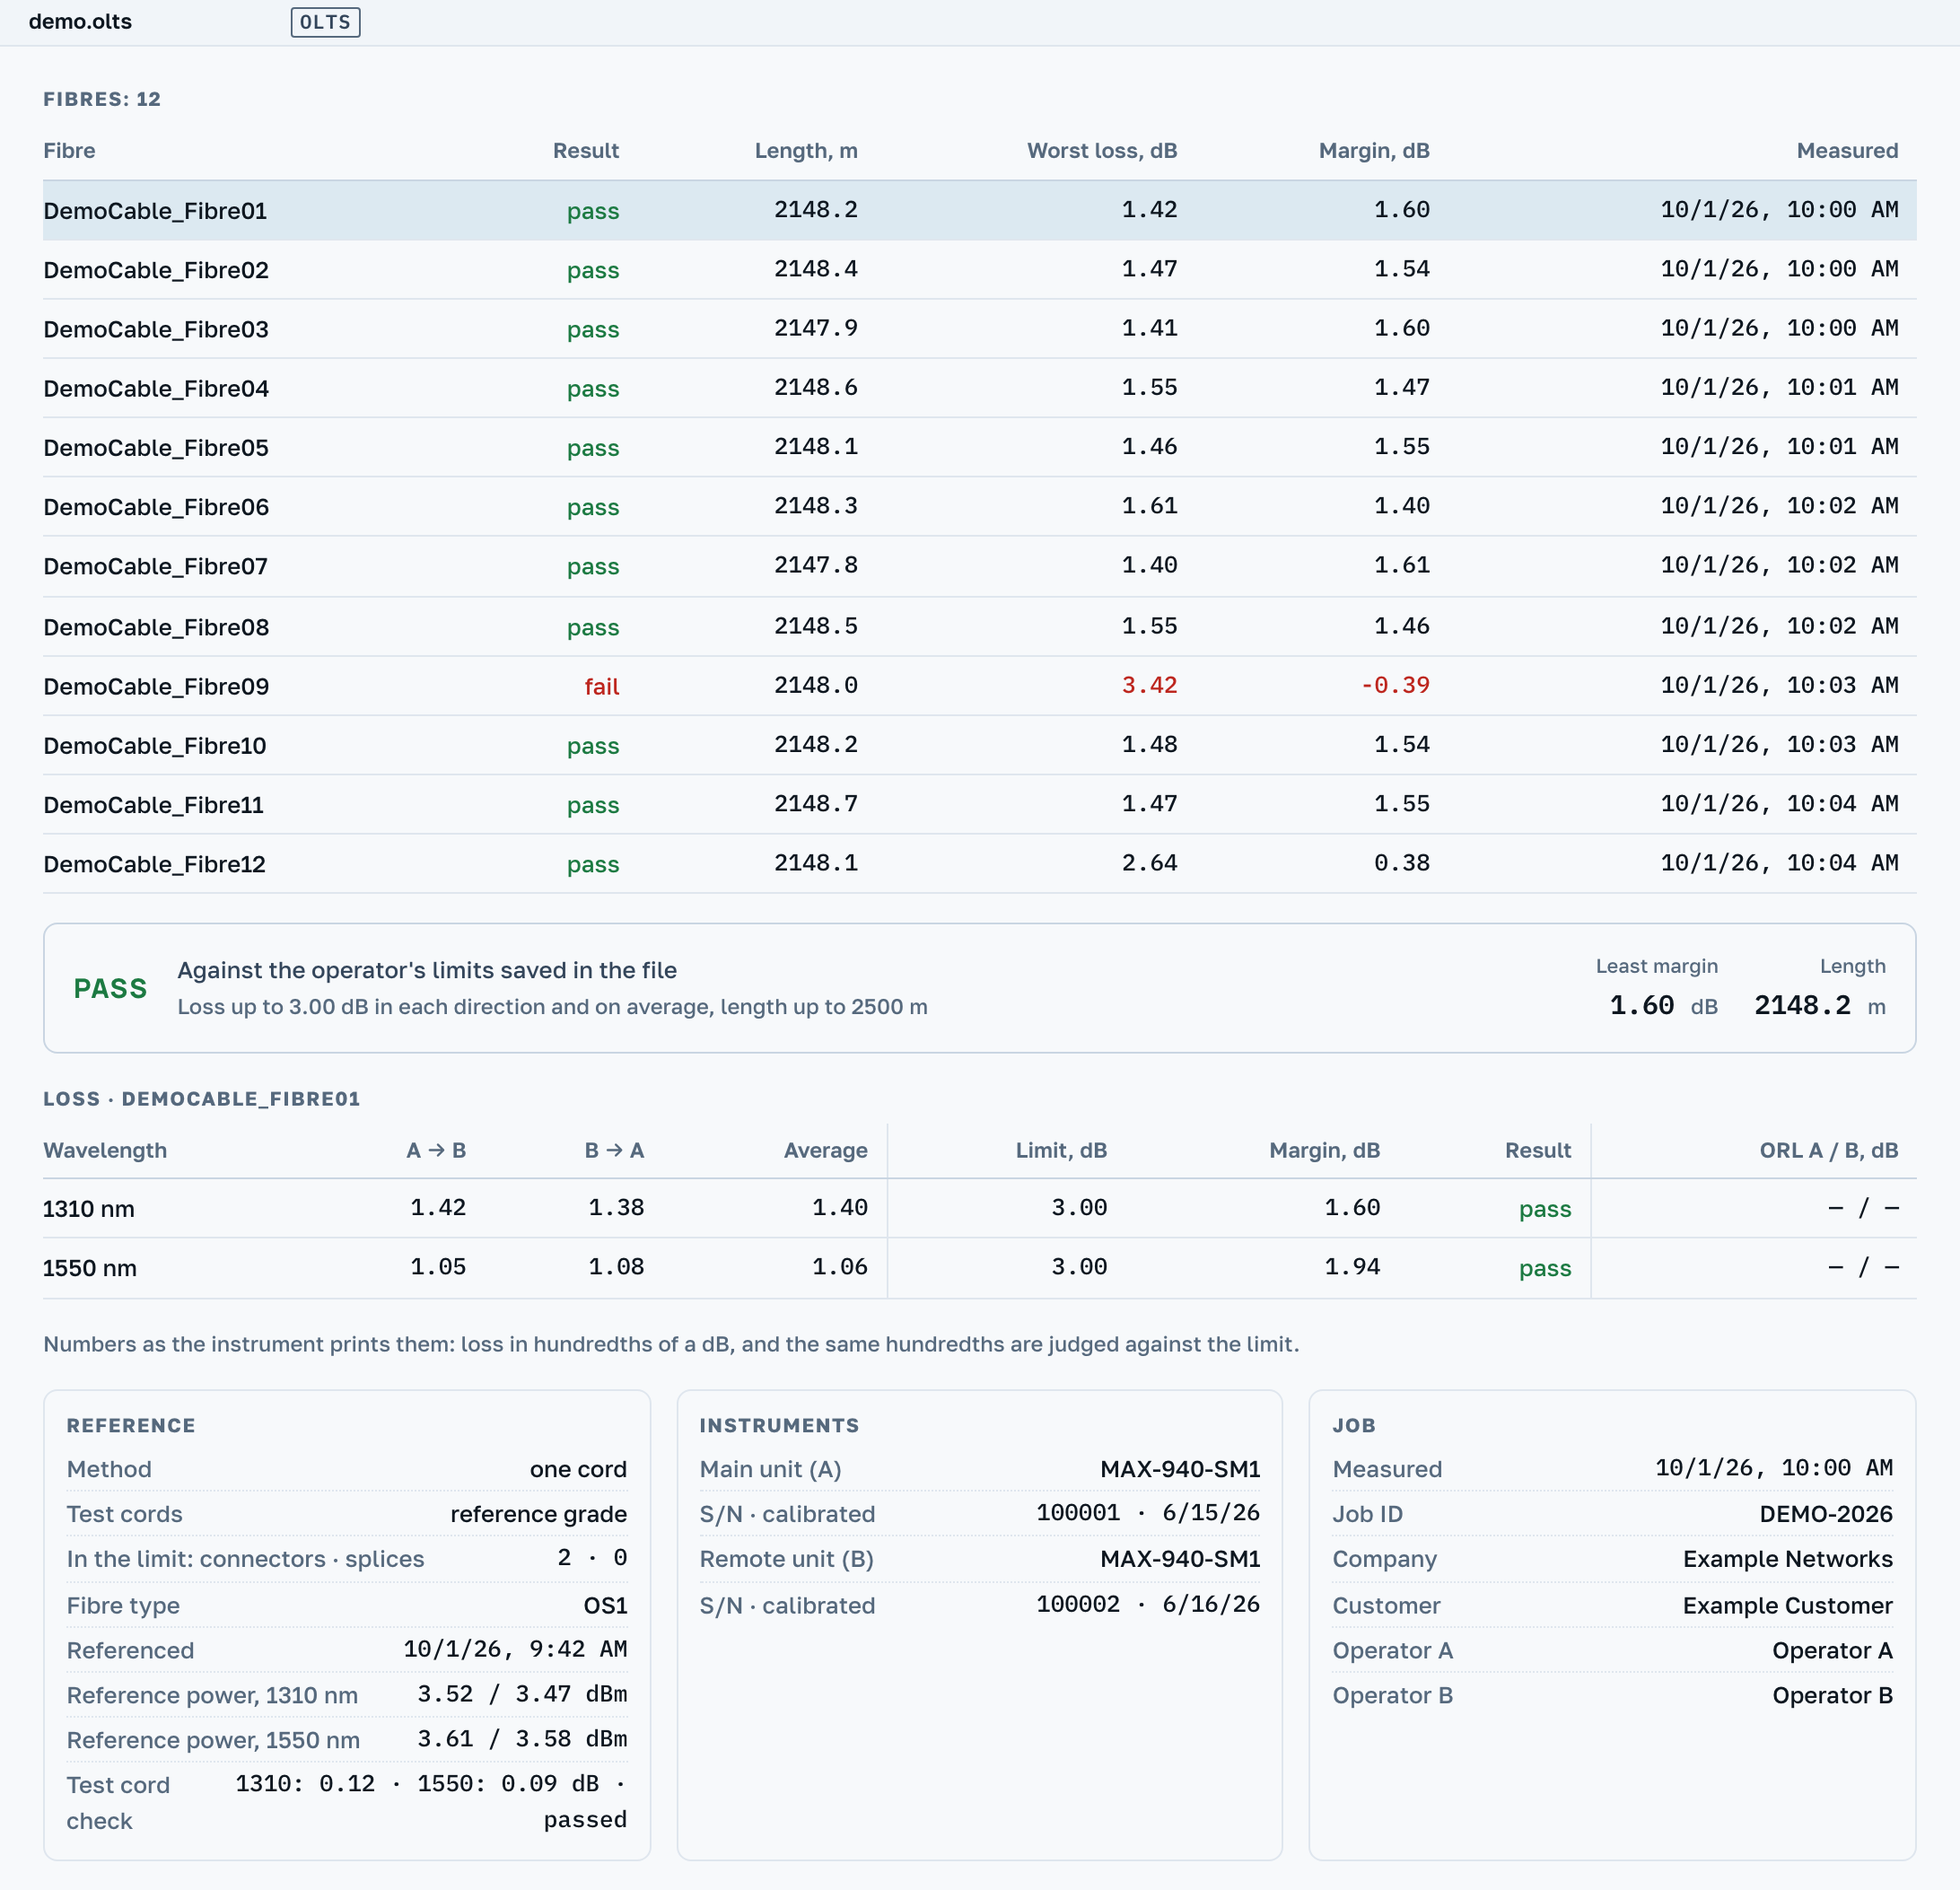
A loss test set gives one figure per fibre and wavelength: how much light the whole link lost. The file carries both directions with it, the reference, the instruments and the limits, and it may carry no verdict at all.
EXFO results (.olts, .oltsx) and fibre tests from a Fluke LinkWare database (.flw) open. A result card takes the place of the chart: such a file has no curve.
By Ilya (engineer, 6 years in fibre optics) ·
What the file holds
A light source sits at one end of the link and a power meter at the other. The set compares how much light went in with how much came out and records the difference. In a bidirectional test the units swap roles, and the file ends up with three loss figures per wavelength.
Loss
Loss from A to B, from B to A and their average. The two directions rarely agree to the hundredth, so the set records both. Next to them sits the ORL, optical return loss, measured from each end.
Reference
Before the test the set is zeroed on test cords. The method (one, two or three cords, or a loopback) and the grade of the cords decide which connectors are counted in the loss, so they are printed with the result.
Limits
The file states the allowed loss in one of two ways: as figures the operator entered, or as the name of a standard. Which one it is decides whether the result gets a verdict.
Reading loss and margin
Read the margin first: how far the loss stayed below the limit. A negative margin means a fail.
EXFO's software judges each direction against the limit separately, and the average as well, but the fibre's verdict comes from the average. The margin on the card is the margin of the average. A direction that exceeds the limit on its own is shown in red even when the fibre passes.
Figures are printed the way the instrument prints them, in hundredths of a dB, and the same hundredths are judged against the limit. The file can hold more digits, but the figure on screen matches the one in the vendor's report.
A duplex record holds two fibres: light travels to the far end on one and comes back on the other. EXFO's software shows the length of the pair rather than of each fibre, because a single fibre in such a record can even show a negative length. The card prints the pair length as well.
What is recorded next to the loss
How many cords are in the reference
The reference method decides what counts towards the loss. With one cord the loss of the link includes both of its end connectors, with two it includes one, with three none. The same fibre gives different figures under different references, so results can only be compared when the method is the same. The card names the method and the grade of the test cords in the “Reference” block.
The MPO connector and polarity
On a multi-fibre MPO connector the instrument measures all fibres at once and records the polarity: by which scheme, A, B or C, the fibres of one end arrive at the positions of the other. The card shows each fibre on its own row, with the polarity next to it.
Where the verdict comes from
The word "pass" is not in the file. The limits are, and the software compares against them when the file is opened.
If the operator set the limits, their values are written in the file: a loss limit per wavelength and a length limit, sometimes a lower loss limit and an ORL limit as well. We compare against them by the same rule as EXFO's software and print the verdict, the limit and the margin.
If the file only names a standard, its values are not in the file: the vendor's software keeps the standards tables. We do not ship standard values, so a result like that gets no verdict, and the card names the standard instead. Loss and margins stay on screen, and you can check them against your own document.
A limit can also be a loss budget: attenuation over length plus connectors and splices. The operator entered those terms too, and we work out the limit from them the same way EXFO's software does. The card shows it as a figure in dB for each wavelength.
Sometimes there is no limit at all: the instrument recorded the loss and the reference power, and there is nothing to compare them with. Such a test has no verdict in the maker's program or here, and the card says so.
What is not here yet
EXFO results in .olts, .oltsx and .opm open, manual power meter and manual ORL readings included, and so do Fluke LinkWare databases (.flw). CertiFiber, CertiFiber Pro, DTX, DSP, OMNIScanner, MultiFiber Pro, SimpliFiber and SimpliFiber Pro tests from a Fluke database open like an EXFO result: loss per wavelength and direction, limit, margin, reference power and the instruments. For an MPO connector each of the twelve fibres has its own row, and the polarity is named. The verdict is the one the instrument recorded; SimpliFiber Pro records no limit, so it has no verdict. For other Fluke testers we read the summary: verdict, standard, length, worst loss and margin.
A result prints as a sheet for one fibre: the Report button opens a window where you can fill in the site and the ends of the line. Once you are signed in, the sheet carries a code and a QR, and the person you hand it to opens the same result in a browser. With your own template the sheet prints with your logo, company details, fields and signature lines. A summary sheet for all the fibres of a file is part of paid access: the first page has the result and a table of every fibre, and a sheet for each fibre follows. Files in .oltsx are judged by the operator's limits when the file carries them.
The file opens read-only. There is nothing in it to edit, and it cannot become a .sor: it has no curve.
Next
.olts result→
Open LinkWare fibre tests→
Fluke fiber test results explained→
If your loss test file did not open, send it to us: that is how we learn which format to read next.